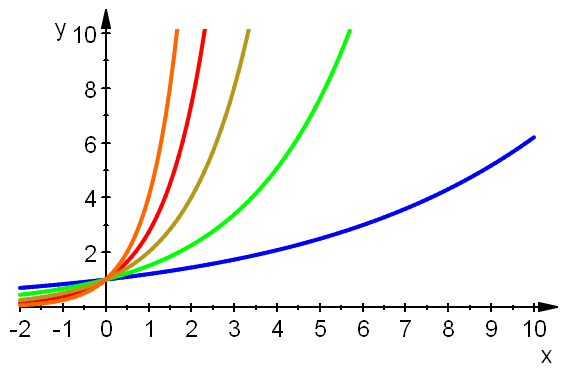
plotfunc2d(1.2^x,E^x,1.5^x,2^x,4^x,x=-2..10, LegendVisible=FALSE, ViewingBoxYRange=0..10,AxesLineWidth=0.5, AxesTitleFont=["Arial", 14],TicksLabelFont=["Arial",14], LineWidth=0.8)
Exponentialfunktionen
und ihr schnelles Wachstum
Prof. Dr. Dörte Haftendorn, MuPAD 4, Aug 08 Update 27. Aug 08
http://haftendorn.uni-lueneburg.de www.mathematik-verstehen.de
www.mathematik-sehen-und-verstehen.de
++++++++++++++++++++++++++++++++++++++++++++++++++++++++++
plotfunc2d(1.2^x,E^x,1.5^x,2^x,4^x,x=-2..10, LegendVisible=FALSE, ViewingBoxYRange=0..10,AxesLineWidth=0.5, AxesTitleFont=["Arial", 14],TicksLabelFont=["Arial",14], LineWidth=0.8)

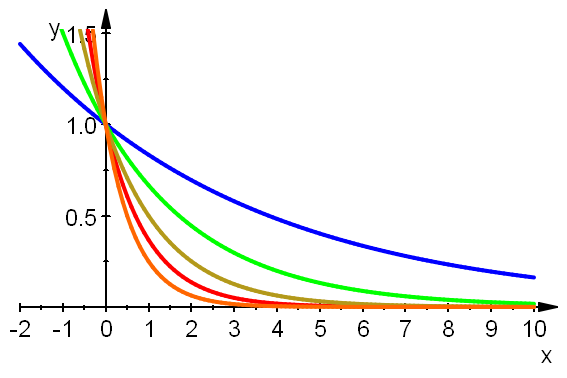
plotfunc2d(1.2^(-x),E^(-x),1.5^(-x),2^(-x),4^(-x),x=-2..10, LegendVisible=FALSE, ViewingBoxYRange=0..1.5,AxesLineWidth=0.5, AxesTitleFont=["Arial", 14],TicksLabelFont=["Arial",14], LineWidth=0.8)
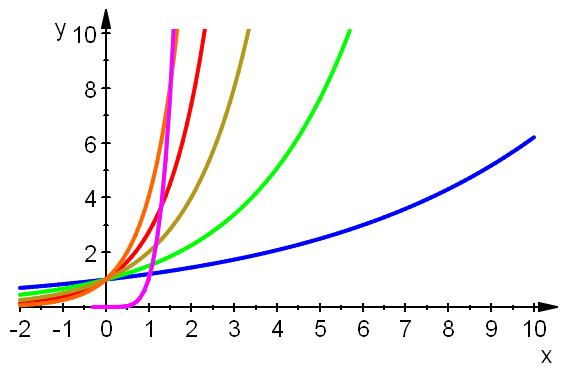
Die nachfolgenden Bilder zeigen in lila das Poynom y=x^5
im Vergleich mit Exponentialfunktionen.
Es wird jeweis ein anderes Fenster dargestellt.
plotfunc2d(1.2^x,E^x,1.5^x,2^x,4^x,x^5,x^5,x=-2..10, LegendVisible=FALSE, ViewingBoxYRange=0..10,AxesLineWidth=0.5, AxesTitleFont=["Arial", 14],TicksLabelFont=["Arial",14], LineWidth=0.8)
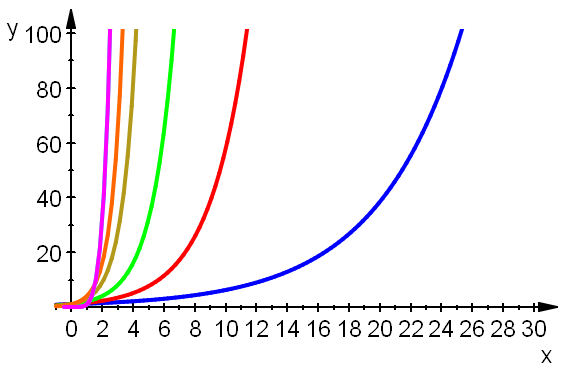
plotfunc2d(1.2^x,E^x,1.5^x,2^x,4^x,x^5,x^5,x=-2..130, LegendVisible=FALSE, ViewingBoxYRange=0..10^10,AxesLineWidth=0.5, AxesTitleFont=["Arial", 14],TicksLabelFont=["Arial",14], LineWidth=0.8)
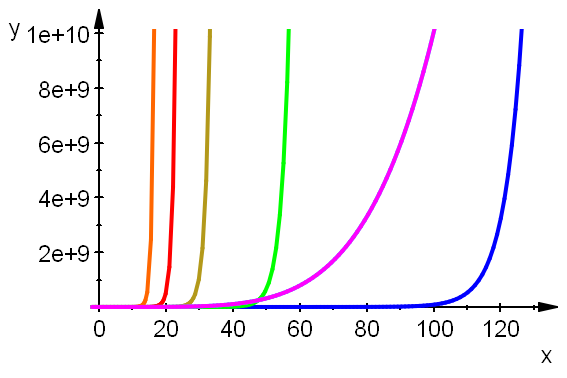
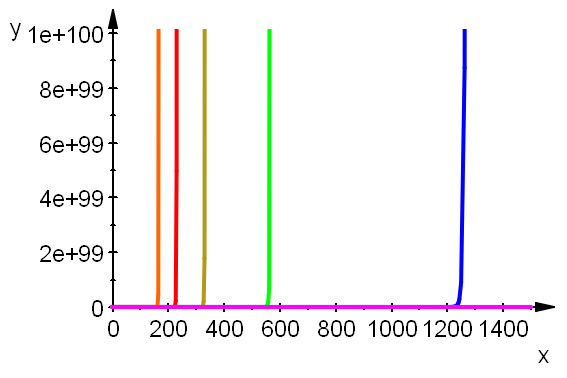
plotfunc2d(1.2^x,E^x,1.5^x,2^x,4^x,x^5,x^5,x=-2..1500, LegendVisible=FALSE, ViewingBoxYRange=0..10^100,AxesLineWidth=0.5, AxesTitleFont=["Arial", 14],TicksLabelFont=["Arial",14], LineWidth=0.8)
